Why Monte Carlo Simulations Get Retirement Risk Wrong
Ever been terrified by those retirement calculators showing a scary chance of running out of money? That’s Monte Carlo simulations at work—spinning wild “what-if” scenarios that often paint a doom-and-gloom picture far worse than reality.
In my latest video, blog post and podcast episode, we’ll debunk why most of these simulated failures could never happen in real life, how they push you toward boring bond-heavy portfolios that slash your retirement lifestyle by an average of 15-35% in annual spending, and why simply planning flexible actions during market dips is a game-changer for staying wealthy without the fearmongering.
Ignore Monte Carlo panic porn for empowered planning. Focus on adaptability over probabilities.
Retirement isn’t about avoiding every storm—it’s about sailing through them smarter.
You will learn:
- What are Monte Carlo Simulations?
- Why most simulated failures are myths that can’t happen in real life.
- Why the stock market is not a “random walk”.
- How the solution of more bonds can make your retirement miserable.
- Why action plans for market downturns are a better solution.
- Why failures are not catastrophic – just temporary lifestyle adjustments.
- Retirement isn’t about avoiding every storm—it’s about sailing through them smarter.
What are Monte Carlo Simulations?
Monte Carlo simulations are thousands of random market scenarios based on statistics related to historical data to predict retirement “success” rates. They may be based on statistics for the average return and standard deviation of the stock market or they may be snapshots of actual history randomly clipped together in thousands of random ways.
They create a “Bell curve” out of the thousands of results that looks like a hill that is low at left and right sides. The peak of the hill is the most likely scenario, the left tail is your failures and the right tail is great successes.
Monte Carlo simulations can tell you a theoretical chance that you will run out of money during retirement. They are used in financial planning mainly for the theoretical risk of the worst case scenario.
If your plan has only an 80% chance of success, that’s too low, right? That’s a 1 in 5 chance of running out of money? Time to panic?
These tools overestimate risks because they don’t simulate the stock market. They treat markets as purely random chaos.
They also ignore real-world adjustments you can make to your lifestyle or your investments, such as delaying a vacation.
Why most simulated failures are myths that can’t happen in real life.
In reality, most of the left tail failures and right tail successes are fairy tales. They could not happen in real life.
For example, in the tech bubble from 1995-1999, the stock market more than tripled in 5 years. Monte Carlo simulations will include 5 tech bubbles in a row, so that your investments are 250 times as much! Your $100,000 becomes $25 million!
In the global financial crisis of 2008, the market was down about 40%. Monte Carlo simulations would include 5 of these in a row, to put the market down more than 90%! Your $100,000 becomes less than $10,000 in 5 years!
Why can’t we have 5 bubbles or 5 crashes in a row? The market valuation would get ridiculously high or low. At some point smart investors will sell when a market is way too expensive or buy in when it is way too cheap.
The stock market is not a “random walk”. Nobody walks randomly down Wall Street.
Why the stock market is not a “random walk”.
The “random walk theory” states that stock market results are purely random. They are like a coin flip and unaffected by any other results before or after. It’s like a drunk stumbling down the street.
For example, if you have a coin that just flipped heads 10 times in a row, the next flip is still a 50/50 chance of either heads or tails. If the stock market was like that, then you could have 5 bubbles or 5 crashes in a row – because it says the market is not affected by the recent past.
However, the stock market is not like that. With the stock market, big crashes are usually followed immediately by explosive rebounds. The largest losses and largest gains are usually right after each other.
Here are the biggest gains & losses for a day, week, month, year and decade:
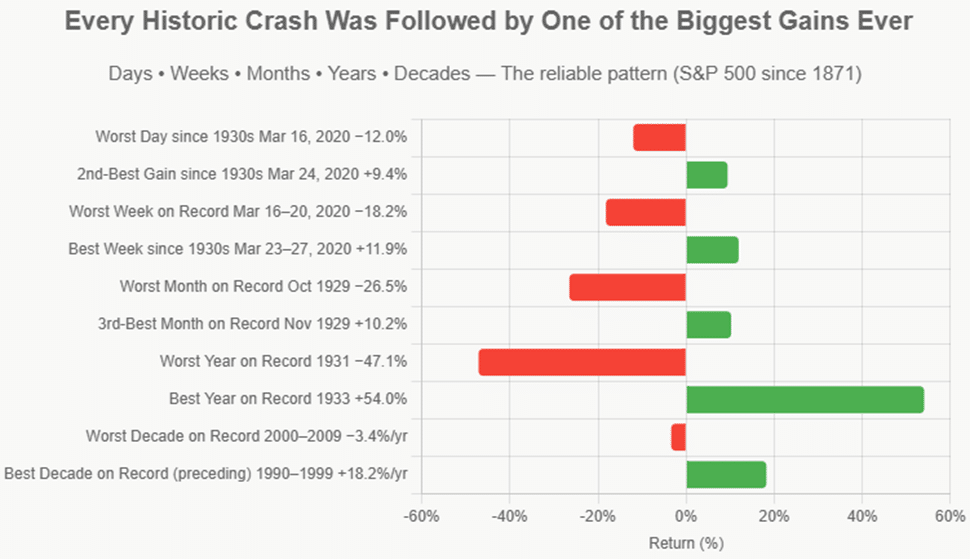
This means that the stock market is significantly more reliable than the random walk theory claims.
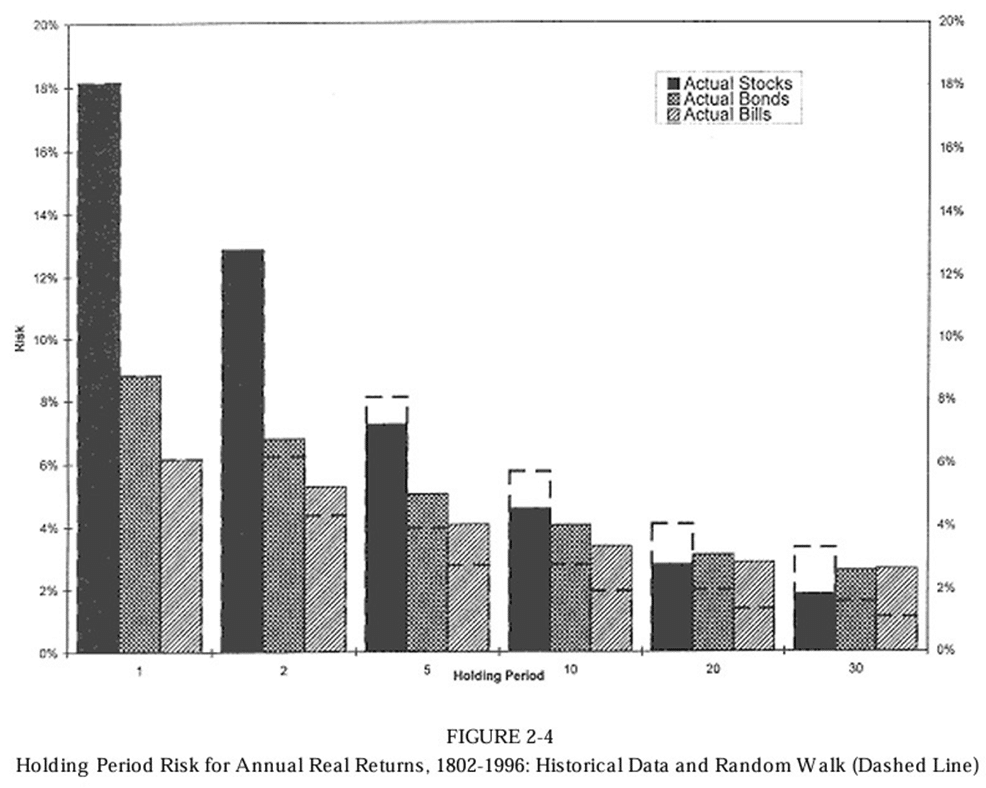
In his historic book “Stocks for the Long Run”, Prof. Jeremy Siegel proved that the Random Walk theory is not accurate for the stock market.
He showed the actual standard deviation (stat for unpredictability) of stocks, bonds & cash in real life and compared them to the random walk theory.
In this chart from his book, the dashed lines are the random walk. Note that actual stock market risk (unpredictability) declines much faster than random walk claims the longer you are invested. The actual standard deviation after 30 years is barely over half the random walk.
In contrast, the risk of bonds and cash declines much more slowly than the random walk the longer you are invested. For cash, the 30-year risk is more than double what the random walk predicts.
The reasons for this is that big gains in the stock market tend to be right after big losses. After a big loss, you almost always recover a large portion of it almost immediately.
However, bad periods of bonds and cash tend to be followed by more bad periods because they usually result from high inflation – which tends to stick around for a while when it appears. Bonds lost half their value after inflation after 40 years during the “Bond Collapse” from 1940-1980. 40 bad years! Then they had their best time ever during the “Bond Bubble” from 1980-2020.
How the solution of more bonds can make your retirement miserable.
The problem with Monte Carlo simulations is that the recommended solution is usually more bonds – which can mean a dramatically lower retirement lifestyle for you.
Financial software often comes with a dial to turn up the amount of bonds to see how much your failure rate declines. But remember – most of the failures are fairy tales!
The result is that you could end up with 20-50% more in bonds to reduce the chance of failures that are mostly fake. The cost to your lifestyle can be huge!
Having 20% more in bonds typically reduces the income from your investments for a 30-year retirement by about 15%. Having 50% more in bonds typically reduces it by about 35%.
For example, investing $3,000/month for 30 years in 100% equities (stock market) can give you a retirement from age 65 to age 100 of $100,000/year inflation-adjusted just from your investments if you keep the same allocation. However, if you switch when you retire at age 65 to 20% bonds and 80% equities, your investments only give you $85,000/year. With 50% bonds and 50% equities starting at retirement, that’s $65,000/year.
That means $15,000/year or $35,000/year less to spend for your entire retirement! There go those extra trips you wanted to take every year. That means $15,000/year or $35,000/year less for travel, hobbies, or gifting—turning a vibrant retirement into a frugal one, all to chase the illusion of “safety.”
Is there a smarter way to deal with failures, especially since most are fake?
Why action plans for market downturns are a better solution.
Having an action plan for what you will do after extra large market declines is a more effective solution. For example, small tweaks, such as delaying a vacation, can fix 90% of “failures”.
We call it “lifeboat drills”. When the market is doing fine, decide what you will do when it declines. When it happens, knowing ahead of time what you will do can reduce or avoid you panicking.
For a comfortable retirement, you can keep investments similar to the allocation you had while growing your nest egg. During retirement, monitor your withdrawals. If your investments are down a lot and you are only withdrawing 4%/year or so from your investments, you probably don’t need to do anything. Just keep enjoying your retirement.
If your lower investments get your withdrawal rate too high, then reduce your spending for a year or a few years until it is back in line.
Market declines rarely last long. In the last 150 years, 88% of stock market declines fully recovered in 1 or 2 years.
The most likely scenario is that you will have to make few or no adjustments during your retirement. My “4% Rule” study showed that withdrawing 4% of your investments and increasing by inflation provided for a 30-year retirement 97% of the time with an allocation of 70%-100% equities with no adjustments.
My study also showed that you can safely withdraw 5%/year or 6%/year with 100% success if you are able to adjust your lifestyle enough in down periods.
Being a bit flexible in your lifestyle from year to year usually means your average retirement income is probably still about the same. Skip a vacation for a year or 2 and then take extra ones in future years. This is unlike being panicked into having more bonds which mean your income is significantly lower for your entire retirement.
Monte Carlo simulations assume you will not adjust either your lifestyle or your portfolio.
However, action beats inaction. An action plan beats accepting a lower lifestyle for life.
Focus on adapting – not probabilities.
Why failures are not catastrophic – just temporary lifestyle adjustments.
In Monte Carlo simulations, a 60% success rate sounds like a disastrous 40% chance of running out of money. However, it really means a 40% chance of minor adjustments, not bankruptcy. And given that most of the failures are fairy tales, probably only a 20% chance of minor adjustments in your lifestyle.
Retirement isn’t about avoiding every storm—it’s about sailing through them smarter.
Ignore Monte Carlo panic porn for empowered planning. Focus on adaptability over probabilities.
Retirement isn’t about avoiding every storm—it’s about sailing through them smarter.
Ed
Planning With Ed

Ed Rempel has helped thousands of Canadians become financially secure. He is a fee-for-service financial planner, tax accountant, expert in many tax & investment strategies, and a popular and passionate blogger.
Ed has a unique understanding of how to be successful financially based on extensive real-life experience, having written nearly 1,000 comprehensive personal financial plans.
The “Planning with Ed” experience is about your life, not just money. Your Financial Plan is the GPS for your life.
Get your plan! Become financially secure and free to live the life you want.
Hi Ed, interesting.
I still don’t get the main points that the simulations are based on random data ie the .com case making it 90% in simulation.
Simulations I use seem to be based on actual historical results. I use https://ficalc.app. Do you refer to a different web tools?